
Earnings season is the multi-week period during which public companies release their earnings reports for the most-recent quarter. Traditionally, high volatility is observed in the markets during this period, which can create more profit opportunities, but also higher risk of capital losses.

UPCOMING EARNINGS ANNOUNCEMENTS


Bookmark the HFM Earnings Calendar to keep up to date with the latest earnings reports for the companies you care about.

Company Market Cap Release Date Time EPS Estimate LAST YEAR SAME QUARTER EPS
The Goldman Sachs Group, Inc. $279,346.9 M 10/13/2026 NTS $15.81 $51.32
Abbott Laboratories $178,194.9 M 10/13/2026 BMO $1.42 $5.15
Citigroup Inc. $226,537.8 M 10/13/2026 BMO $2.68 $7.59
JPMorgan Chase & Co. $935,787.9 M 10/13/2026 BMO $5.88 $20.62
Johnson & Johnson $649,395.4 M 10/13/2026 BMO $2.70 $10.79
Bank of America Corporation $405,299.7 M 10/14/2026 NTS $1.16 $3.81
Alcoa Corp $11,780.9 M 10/15/2026 AMC $1.55 $3.77
Nasdaq Inc $52,929.6 M 10/19/2026 NTS $1.03 $3.48
Coca-Cola Co $374,838.1 M 10/19/2026 BMO $0.88 $3.00
Mattel Inc $3,737.0 M 10/19/2026 AMC $1.01 $1.41
General Electric Company $330,992.8 M 10/20/2026 BMO $2.00 $6.37
Netflix Inc. $305,466.6 M 10/20/2026 AMC $0.82 $2.53
General Motors Co $73,662.1 M 10/20/2026 BMO $3.70 $10.60
Hilton Worldwide Holdings Inc. $69,112.9 M 10/20/2026 BMO $2.35 $8.11
Tesla Inc $1,482,265.1 M 10/20/2026 AMC $0.42 $1.66
Iberdrola S.A. $155,554.7 M 10/21/2026 BMO $0.27 $1.07
International Business Machines Corporation $218,509.2 M 10/21/2026 NTS $2.86 $11.59
Intel Corp $643,615.8 M 10/21/2026 NTS $0.39 $0.42
Freeport-McMoRan Inc $103,623.0 M 10/21/2026 BMO $0.74 $1.77
Alaska Air Group Inc $4,676.2 M 10/21/2026 AMC $0.44 $2.44
SAP SE $257,486.7 M 10/21/2026 AMC $2.11 $7.36
Ford Motor Co $52,516.6 M 10/21/2026 AMC $0.43 $1.09
Nokia Oyj $63,300.8 M 10/22/2026 BMO $0.07 $0.33
Barclays PLC $84,641.1 M 10/22/2026 BMO $0.17 $0.66
Verizon Communications Inc $198,099.7 M 10/22/2026 BMO $1.27 $4.71
Southwest Airlines Co $20,434.2 M 10/22/2026 BMO $0.59 $0.93
American Express Company $211,770.4 M 10/23/2026 NTS $4.54 $15.38
Visa Inc. $690,714.1 M 10/26/2026 NTS $3.43 $11.47
HSBC Holdings PLC $352,219.8 M 10/27/2026 BMO $0.45 $1.51
Microsoft Corporation $3,724,727.9 M 10/27/2026 AMC $4.74 $17.28
Caterpillar Inc $375,324.5 M 10/27/2026 NTS $7.02 $19.06
Starbucks Corp $108,186.0 M 10/27/2026 NTS $0.71 $2.13
Boeing Co $158,982.9 M 10/27/2026 BMO $-0.19 $-6.54
Alphabet Inc. $4,318,622.4 M 10/27/2026 AMC $2.98 $10.81
Banco Santander S.A. $212,952.4 M 10/28/2026 BMO $0.28 $1.06
BNP Paribas SA $127,888.6 M 10/28/2026 BMO $3.48 $13.49
Mapfre SA $15,750.5 M 10/28/2026 BMO $0.11 $0.44
Mercedes-Benz Group AG $48,192.1 M 10/28/2026 BMO $1.57 $6.34
Deutsche Bank AG $72,682.8 M 10/28/2026 BMO $1.01 $3.89
GSK plc $103,538.4 M 10/28/2026 BMO $0.70 $2.35
Airbus SE $177,207.3 M 10/28/2026 NTS $2.16 $9.34
Amazon.com Inc $2,787,722.7 M 10/28/2026 NTS $1.98 $7.17
Illumina Inc $36,061.8 M 10/28/2026 NTS $1.36 $4.84
Mastercard Incorporated $497,267.0 M 10/28/2026 BMO $5.15 $17.01
TAL Education Group $6,541.6 M 10/28/2026 BMO $0.15 $0.99
Coinbase Global Inc $53,044.4 M 10/29/2026 AMC $-0.23 $4.45
TotalEnergies SE $205,829.9 M 10/29/2026 BMO $3.54 $6.89
Apple Inc. $4,947,135.1 M 10/29/2026 AMC $1.99 $7.46
Banco Bilbao Vizcaya Argentaria SA $160,888.6 M 10/29/2026 BMO $0.61 $2.07
Volkswagen AG $43,190.5 M 10/29/2026 BMO $5.55 $15.50
Adidas AG $28,549.6 M 10/29/2026 NTS $3.64 $8.68
Chevron Corporation $402,405.3 M 10/29/2026 BMO $4.82 $7.29
Altria Group Inc $114,427.6 M 10/29/2026 BMO $1.51 $5.42
Exxonmobil Holdings Corp $650,915.7 M 10/29/2026 BMO $3.48 $6.99
TechnipFMC PLC $27,965.2 M 10/29/2026 BMO $0.89 $2.45
Credit Agricole SA $63,942.6 M 10/30/2026 BMO $0.65 $2.57
NatWest Group PLC $75,440.1 M 10/30/2026 BMO $0.26 $0.95
CaixaBank SA $105,297.8 M 10/30/2026 BMO $0.26 $1.00
BP PLC $114,188.5 M 10/30/2026 NTS $0.32 $0.48
Berkshire Hathaway Inc $1,074,250.1 M 10/30/2026 BMO $8,242.23 $30,936.02
Rivian Automotive Inc $22,239.1 M 11/02/2026 NTS $-0.61 $-2.39
Pfizer Inc. $158,108.9 M 11/02/2026 BMO $0.76 $3.22
Zalando SE $6,181.3 M 11/03/2026 BMO $0.35 $0.94
Deutsche Lufthansa AG $10,548.6 M 11/03/2026 NTS $1.03 $1.30
McDonald's Corp $175,410.2 M 11/03/2026 BMO $3.41 $12.20
Uber Technologies, Inc. $144,695.0 M 11/03/2026 BMO $0.99 $4.73
Albemarle Corp $13,325.1 M 11/03/2026 AMC $2.63 $-0.79
Devon Energy Corporation $52,349.0 M 11/03/2026 AMC $1.19 $3.92
Snap Inc $9,639.8 M 11/03/2026 AMC $0.17 $0.35
Bayerische Motoren Werke Aktiengesellschaft $42,449.2 M 11/04/2026 BMO $1.09 $13.75
Continental AG $15,827.2 M 11/04/2026 BMO $1.63 $9.26
BT Group PLC $26,579.1 M 11/04/2026 BMO $0.04 $0.24
eBay Inc. $48,193.5 M 11/04/2026 BMO $1.40 $5.52
Microchip Technology Inc $40,606.2 M 11/04/2026 NTS $0.93 $1.64
QUALCOMM Incorporated $203,941.5 M 11/04/2026 AMC $2.16 $12.03
ArcelorMittal SA $55,941.3 M 11/05/2026 BMO $1.22 $3.85
Engie SA $69,162.4 M 11/05/2026 NTS $0.31 $2.30
International Consolidated Airlines Group, S.A. $25,267.8 M 11/06/2026 BMO $0.33 $0.82
Tyson Foods Inc $18,300.7 M 11/09/2026 BMO $0.56 $4.12
Bilibili Inc $6,356.3 M 11/09/2026 BMO $0.27 $0.85
Bayer AG $55,210.3 M 11/10/2026 BMO $0.56 $5.71
Infineon Technologies AG $87,251.0 M 11/10/2026 BMO $0.74 $1.61
Porsche Automobil Holding SE $4,819.5 M 11/10/2026 NTS $2.64 $9.96
Cisco Systems Inc $439,440.7 M 11/10/2026 NTS $1.32 $4.33
RWE AG $53,533.7 M 11/11/2026 BMO $0.77 $2.85
The Walt Disney Company $179,972.6 M 11/11/2026 BMO $1.68 $5.93
Allianz SE $194,079.3 M 11/12/2026 BMO $10.18 $33.75
Siemens AG $245,145.3 M 11/12/2026 BMO $3.27 $14.09
Telefonica SA $23,277.1 M 11/12/2026 BMO $0.12 $0.39
Alibaba Group Holding Limited $287,710.9 M 11/23/2026 BMO $1.60 $3.95
HP Inc $29,714.0 M 11/23/2026 AMC $0.76 $3.12
Salesforce Inc. $194,573.7 M 12/01/2026 NTS $3.44 $12.52
thyssenkrupp AG $10,510.5 M 12/08/2026 BMO $0.12 $1.93
Broadcom Inc $1,731,204.6 M 12/09/2026 NTS $3.83 $6.82
Lloyds Banking Group PLC $85,136.5 M 01/27/2027 BMO $0.04 $0.12
Hermes International SCA $162,927.4 M 02/11/2027 BMO - $51.12

BMO – Before Market Open

AMC – After Market Close

NTS = No Time Stated

*Please note (i) the above list of companies is for informational purposes only and should not be construed as investment advice; (ii) the expected release date of company earnings reports is subject to change without notice.

Source: LSEG

WHY TRADE EARNINGS SEASON WITH HFM

Top Growth Stocks

All the best possible opportunities to add to your investment portfolio

Receive Dividends

Trade CFDs on Stocks and receive dividends directly into your account

18 Trading Tools

Plan your trades effectively with our wide range of free trading tools

13 Trading Platforms

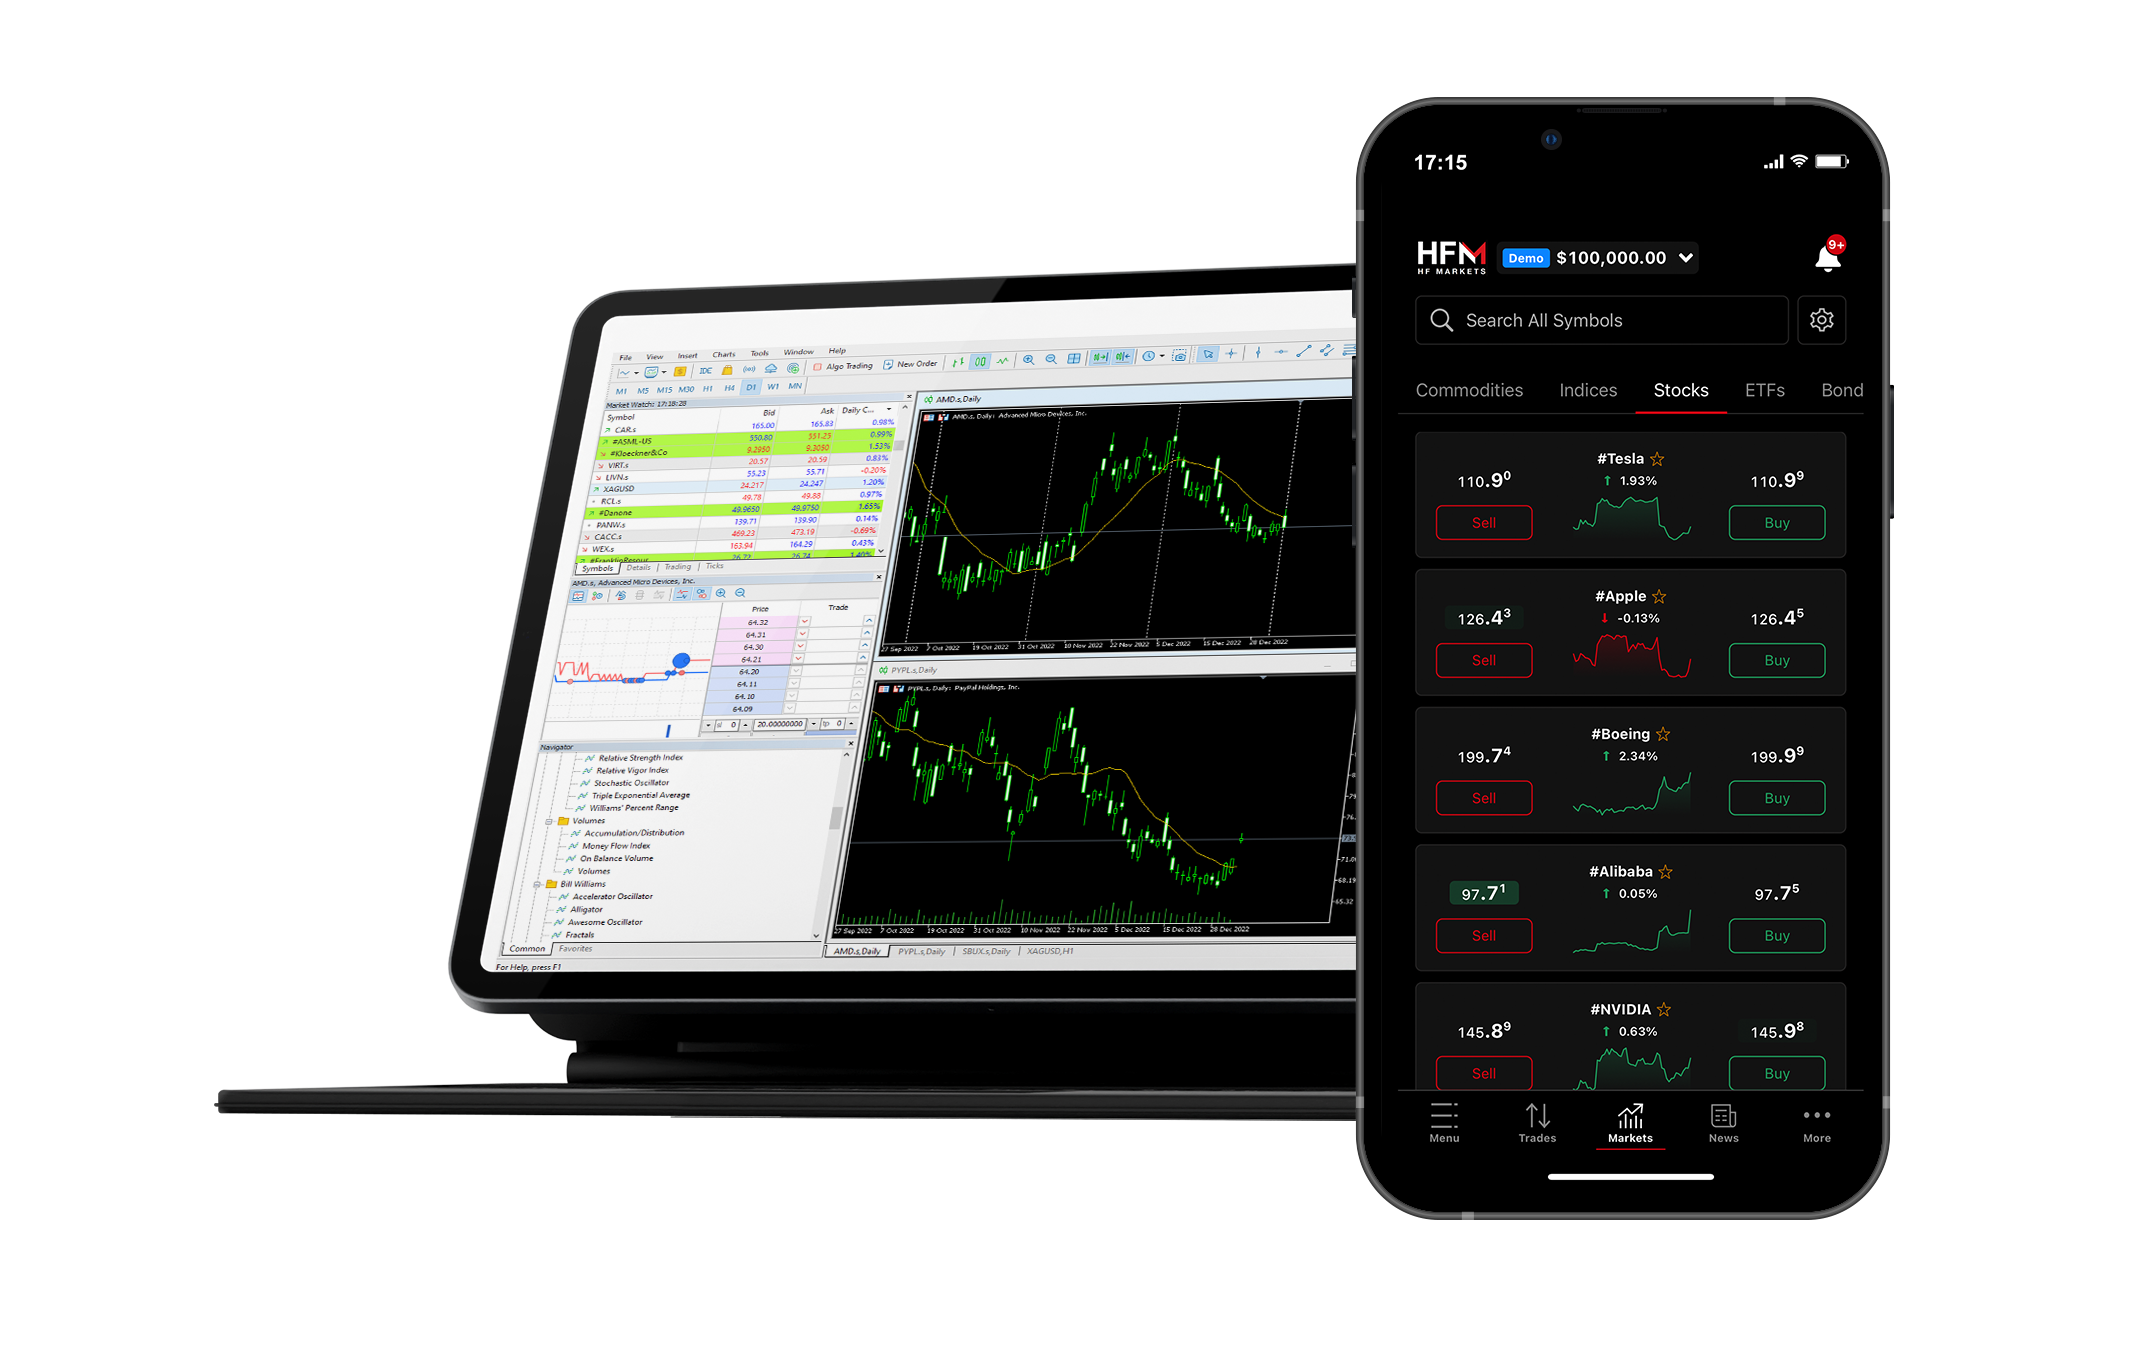
Powerful platforms to suit all trading styles and needs on any device

Fast Execution & Strong Liquidity

Benefit from ultra-fast execution and deep liquidity

FAQs

Earnings reports are quarterly financial statements issued by publicly traded companies. An earnings report discloses the profits (or losses) earned by a company in each quarter, along with revenues, other performance metrics and importantly the expected outlook for the company for future quarters and years ahead.

Publicly traded companies are required to provide their shareholders and the broader public with a complete picture of how the business is doing each quarter. Hence, their earnings reports show the company’s profitability and overall financial stability. Understanding earnings reports is imperative for good fundamental investing.

Most companies follow the traditional calendar year for reporting. That drives the following four earnings seasons, with reporting normally starting about 2 weeks after the end of each quarter.
  • First quarter (Q1) ends March 31.
  • Second quarter (Q2) ends June 30.
  • Third quarter (Q3) ends September 30.
  • Fourth quarter (Q4) ends December 31.

Company earnings are a key driver of stock price. It is not unusual for the price of a stock to rise or decline significantly both before and immediately after an earnings report.

Market expectations, as measured most commonly, by analysts’ earnings-per-share and revenue estimates, set the tone for how the company is likely to perform. Stock prices tend to rise when earnings results exceed market expectations while disappointing earnings results tend to lower share prices.

Dividends are regular profit-sharing payments made between a company and its shareholders. At HFM, you can receive dividends directly into your account when trading CFD stocks.

No. Companies may choose to release their reports earlier or later than the expected date, or at a different time. But most do release their data at the expected time and date.

Most companies release their earnings before the market opens (BMO), or after market close (AMC). However, some companies choose to release their earnings report during the trading day.

Although there is no set sequence, the earnings season typically starts with the big banks, and ends with the retailers. The blue chip technology companies also tend to report towards the end of the season.